
Quick answer
Choose a data visualization color palette by what color means: categorical colors distinguish groups, sequential colors show an ordered amount, and diverging colors show departures on either side of a meaningful midpoint. Define the values behind the legend and keep missing data distinct from zero. Labels, values, and other visible cues should carry the meaning alongside color.
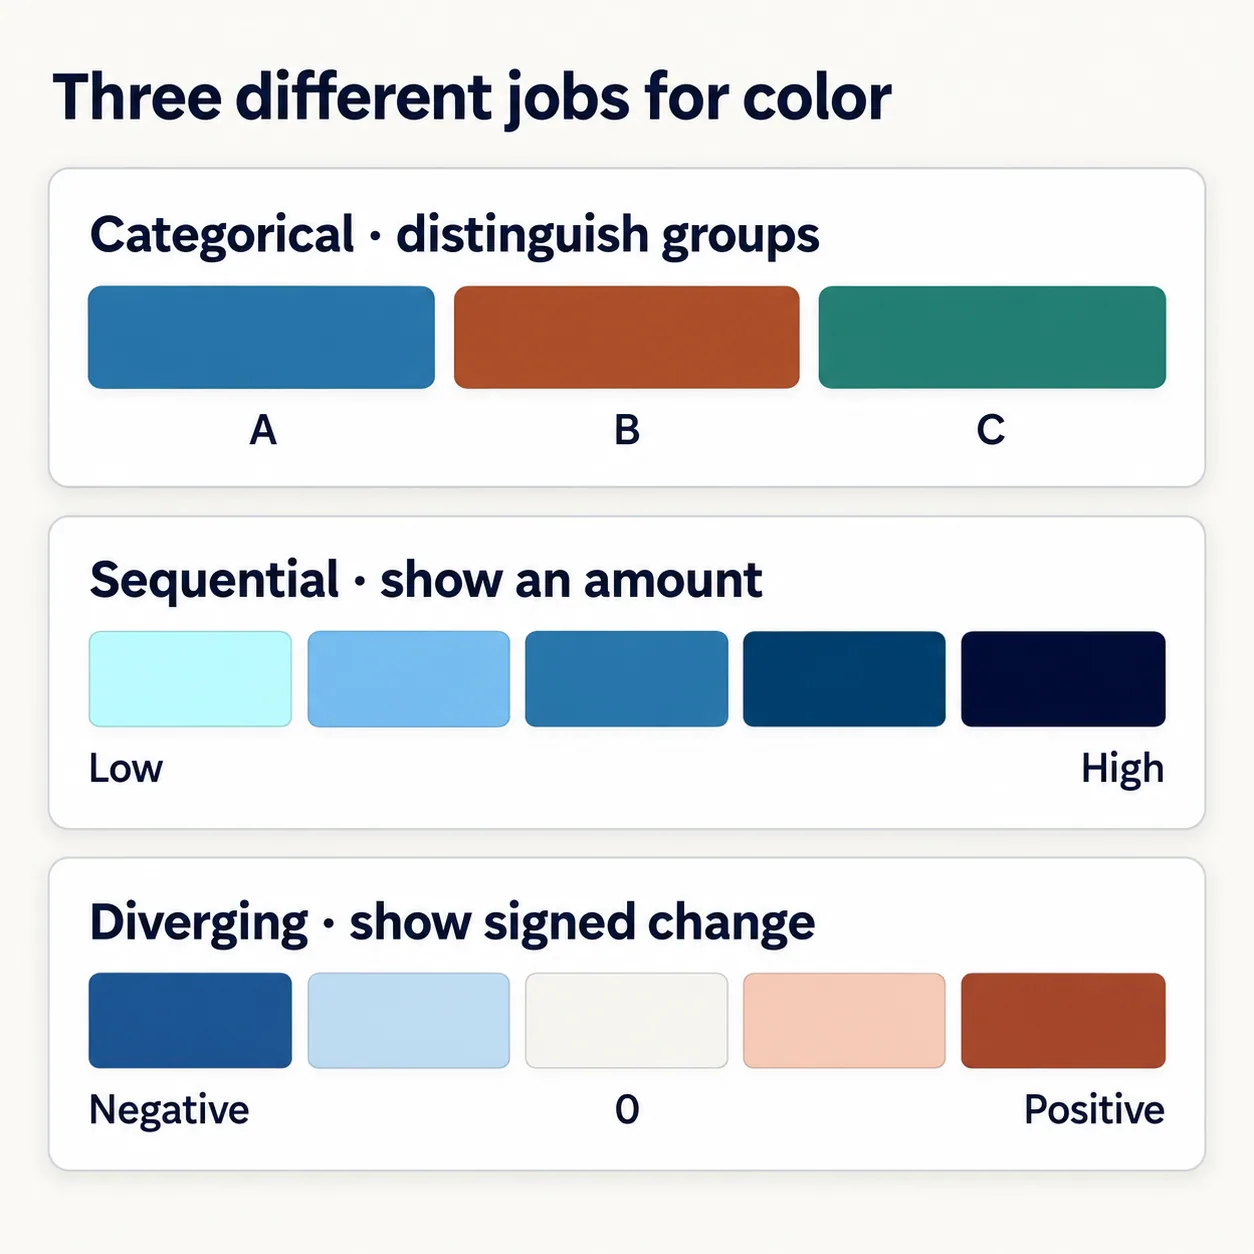
A dashboard might show three service types, room utilization, and the change from last month. Giving all three panels the same five brand colors creates a tidy appearance, but leaves an important question unanswered: does a darker color mean a different group, a larger number, or a bigger change?
A useful data visualization color palette starts with that meaning. Consider the following examples as design exercises, not measurements from an organization. The aim is to make the legend precise enough that another designer or developer can reproduce the same interpretation.
Choose a data visualization color palette by its job
| Question the reader asks | Palette family | What to preserve |
|---|---|---|
| Which service is this: chat, email, or phone? | Categorical, also called qualitative | A stable identity for each group; no implied numeric rank. |
| How much of the room capacity is used? | Sequential | A consistent low-to-high progression. |
| How far above or below last month is utilization? | Diverging | The reference point and the direction of change. |
Categorical palettes separate identities. Sequential palettes use an ordered progression, often from light to dark. Diverging palettes use two branches around a meaningful center, often with a quieter color at that center. These are three common families rather than a complete taxonomy; cyclic quantities such as compass direction need a different treatment because their endpoints meet.
Do not introduce a midpoint just because a two-color gradient looks attractive. In the change panel, zero means no change, so it earns that role. For utilization itself, 50% is merely halfway through the range unless the product gives it a particular meaning. The two panels therefore need different legends even though both display percentages.
Write the legend before styling the chart
For the illustrative utilization panel, define the domain as 0–100% and choose five fixed intervals. A value of 20% belongs to the second interval, not both the first and second. A value of 100% belongs to the final interval. That small boundary decision belongs in the implementation notes as well as the visible legend.
Keep these intervals fixed when comparing rooms or months. If each panel quietly scales its own minimum and maximum to the lightest and darkest colors, the same blue can represent different quantities. If a locally scaled view is useful, label the range clearly and avoid presenting it as a direct color comparison.
Give missing observations a separate treatment, such as a labeled “No data” cell with a hatch. Zero is a measured value and belongs in the lowest interval; absence of a measurement does not. Likewise, decide how out-of-range inputs will be handled instead of silently making them look like valid endpoints.
A verified five-color candidate from Hue Codex
In the Lightness Ladder Generator, set Hue seed to #286F9B, Steps to 5, Model to OKLCH lightness, Review focus to Palette ramp, and Export to JSON data. The tool preserves the source as the middle step and produces the following values. The utilization intervals are assigned here for the example; the generator does not choose data ranges or render a chart.
| Utilization value | Exported token | Color |
|---|---|---|
| 0% to below 20% | ladder-100 | #B4FBFF |
| 20% to below 40% | ladder-300 | #6EB3E2 |
| 40% to below 60% | ladder-500 | #286F9B |
| 60% to below 80% | ladder-700 | #003962 |
| 80% through 100% | ladder-900 | #00062C |
These exact exported HEX colors were checked independently: their OKLab lightness decreases in order. That verifies the direction of this candidate ramp, not equal visual spacing or guaranteed readability. Converting generated colors into sRGB can change their lightness, so do not treat the tool’s requested lightness values as measurements of the final HEX output.
The token numbers are names, not utilization values. A cell containing 52% would use ladder-500 in this example because it falls in the 40%–below-60% interval. Keep “52%” visible in the cell or an adjacent data view, so the reader can recover the quantity without estimating a shade. Review pale cells against the actual chart background before accepting the design.
Keep category identity stable when the data changes
The service-type panel has a different contract. Assign color by the service identifier, not its current position in a sorted list. Otherwise, sorting by volume or filtering out one service can silently transfer its color to another. Carry the same assignment into labels, legends, and related charts.
If the question is simply which service has the largest count, labeled bars may only need one color: their lengths already encode the amounts. Add distinct hues when readers need to track identities across views. As the number of categories grows, consider direct labels, grouping, or separate small charts before adding more colors to a crowded legend.
Review the finished chart, not just the swatch strip
For the change panel, label the measure as percentage-point change if it subtracts two utilization percentages. A move from 40% to 50% is +10 percentage points. Keep a visible zero reference, signed values, and clear labels for the two directions. Do not make readers infer whether blue means improvement, decline, or simply one side of zero.
WCAG’s Use of Color requirement addresses color-only meaning. Direct labels, visible values, patterns, and distinct line markers can provide additional cues. Non-text Contrast separately addresses parts of graphics required to understand the content, generally requiring 3:1 against adjacent colors, subject to the criterion’s exceptions. This is not a requirement that every possible pair in a palette must reach 3:1, and labels alone do not automatically make essential chart boundaries distinguishable.
Use the Color Accessibility Guide to plan the rest of the review: text labels against their backgrounds, meaningful marks and boundaries, selected states, and keyboard interaction for chart controls. Check the actual small-screen chart and any exported image, with its legend and values still available. A palette choice does not establish complete accessibility.
Questions about chart palettes
Can a brand palette serve every chart?
It can supply candidates, but the data relationship still decides their jobs. A brand accent may anchor a sequential ramp or highlight one category without being suitable for every series, interval, or diverging endpoint.
Should a heatmap always use five colors?
No. Five intervals make this example easy to inspect. Choose the number and boundaries for the task, data distribution, and available display space. A continuous scale can serve a different reading task; its legend still needs a defined domain and meaningful ticks.
Can the lightest color mean no data?
Only if it is kept distinct from every valid value and clearly labeled. In the example, the lightest blue already means the lowest measured interval, so missing data needs a separate treatment.
Save the meaning with the palette
Take one chart and write a short color specification: the question it answers, the variable and unit, category IDs or numeric boundaries, midpoint if any, missing-data treatment, and exact color values. Include the labels or patterns that preserve meaning without color. Save that record beside the Hue Codex export so the next revision keeps the interpretation intact.
Spot an issue or want a color topic covered?Send a correction or request a post.